Log Analysis with Splunk
Overview
Room URL: https://tryhackme.com/room/splunkforloganalysis-aoc2025-x8fj2k4rqp
Difficulty: Medium
Category: SOC Monitoring
Date Completed: 12/3/2025
Objectives
- Ingest and interpret custom log data in Splunk
- Create and apply custom field extractions
- Use Search Processing Language (SPL) to filter and refine search results
- Conduct an investigation within Splunk to uncover key insights
Table of Contents
Introduction
Walk Through
Lessons Learned
Resources
Introduction
As King Malhare's forces tightened their grip on Wareville, the TBFC SOC team faced their most critical challenge yet: reconstructing the attack on their web infrastructure to identify the perpetrators and recover McSkidy. The attackers had left a digital footprint across thousands of log entries, but without the right tools and techniques, finding the needle in the haystack would be impossible. Enter Splunk, a powerful log aggregation and analysis platform that transforms raw event data into actionable intelligence. In this challenge, you'll harness Splunk's capabilities to trace the attack chain from initial reconnaissance through ransomware deployment, uncovering the attacker's IP address, tactics, and the extent of the data breach. By analyzing web traffic patterns and firewall logs, you'll piece together the complete story of how King Malhare's Bandit Bunnies compromised the web server and established command-and-control communications—intelligence that will prove crucial in the race to save Christmas itself.
What is Splunk
Splunk is a leading Security Information and Event Management (SIEM) platform that ingests, indexes, and analyzes machine-generated data from across an organization's IT infrastructure. It collects logs from web servers, firewalls, endpoints, applications, and network devices, making it possible to search, visualize, and correlate events across multiple sources in real-time.
Why Splunk is Critical for Security Analysts
- Unified Log Aggregation: Splunk centralizes logs from disparate sources (web traffic, firewall events, system logs) into a single searchable index, eliminating the need to manually check individual systems.
- Advanced Search Capabilities: Using Splunk's powerful query language (SPL - Splunk Processing Language), analysts can filter, correlate, and aggregate massive datasets to identify patterns that would be impossible to spot manually.
- Threat Investigation & Forensics: Splunk enables rapid timeline reconstruction, allowing analysts to trace attacker activities chronologically from reconnaissance through exploitation and data exfiltration.
- Data-Driven Incident Response: By quantifying attack metrics (bytes transferred, failed login attempts, suspicious user agents), Splunk provides evidence-based insights that support both immediate response and post-incident reporting.
Essential Splunk Search Queries for Attack Investigation
1. Initial Data Discovery & Index Verification
Query: index=main
Purpose: Establishes baseline awareness of all indexed data and identifies available source types. This foundational search reveals the scope of available logs and confirms that both web traffic and firewall data have been successfully ingested.
Key Insight: Selecting "All time" in the time range dropdown ensures you capture the complete attack timeline.
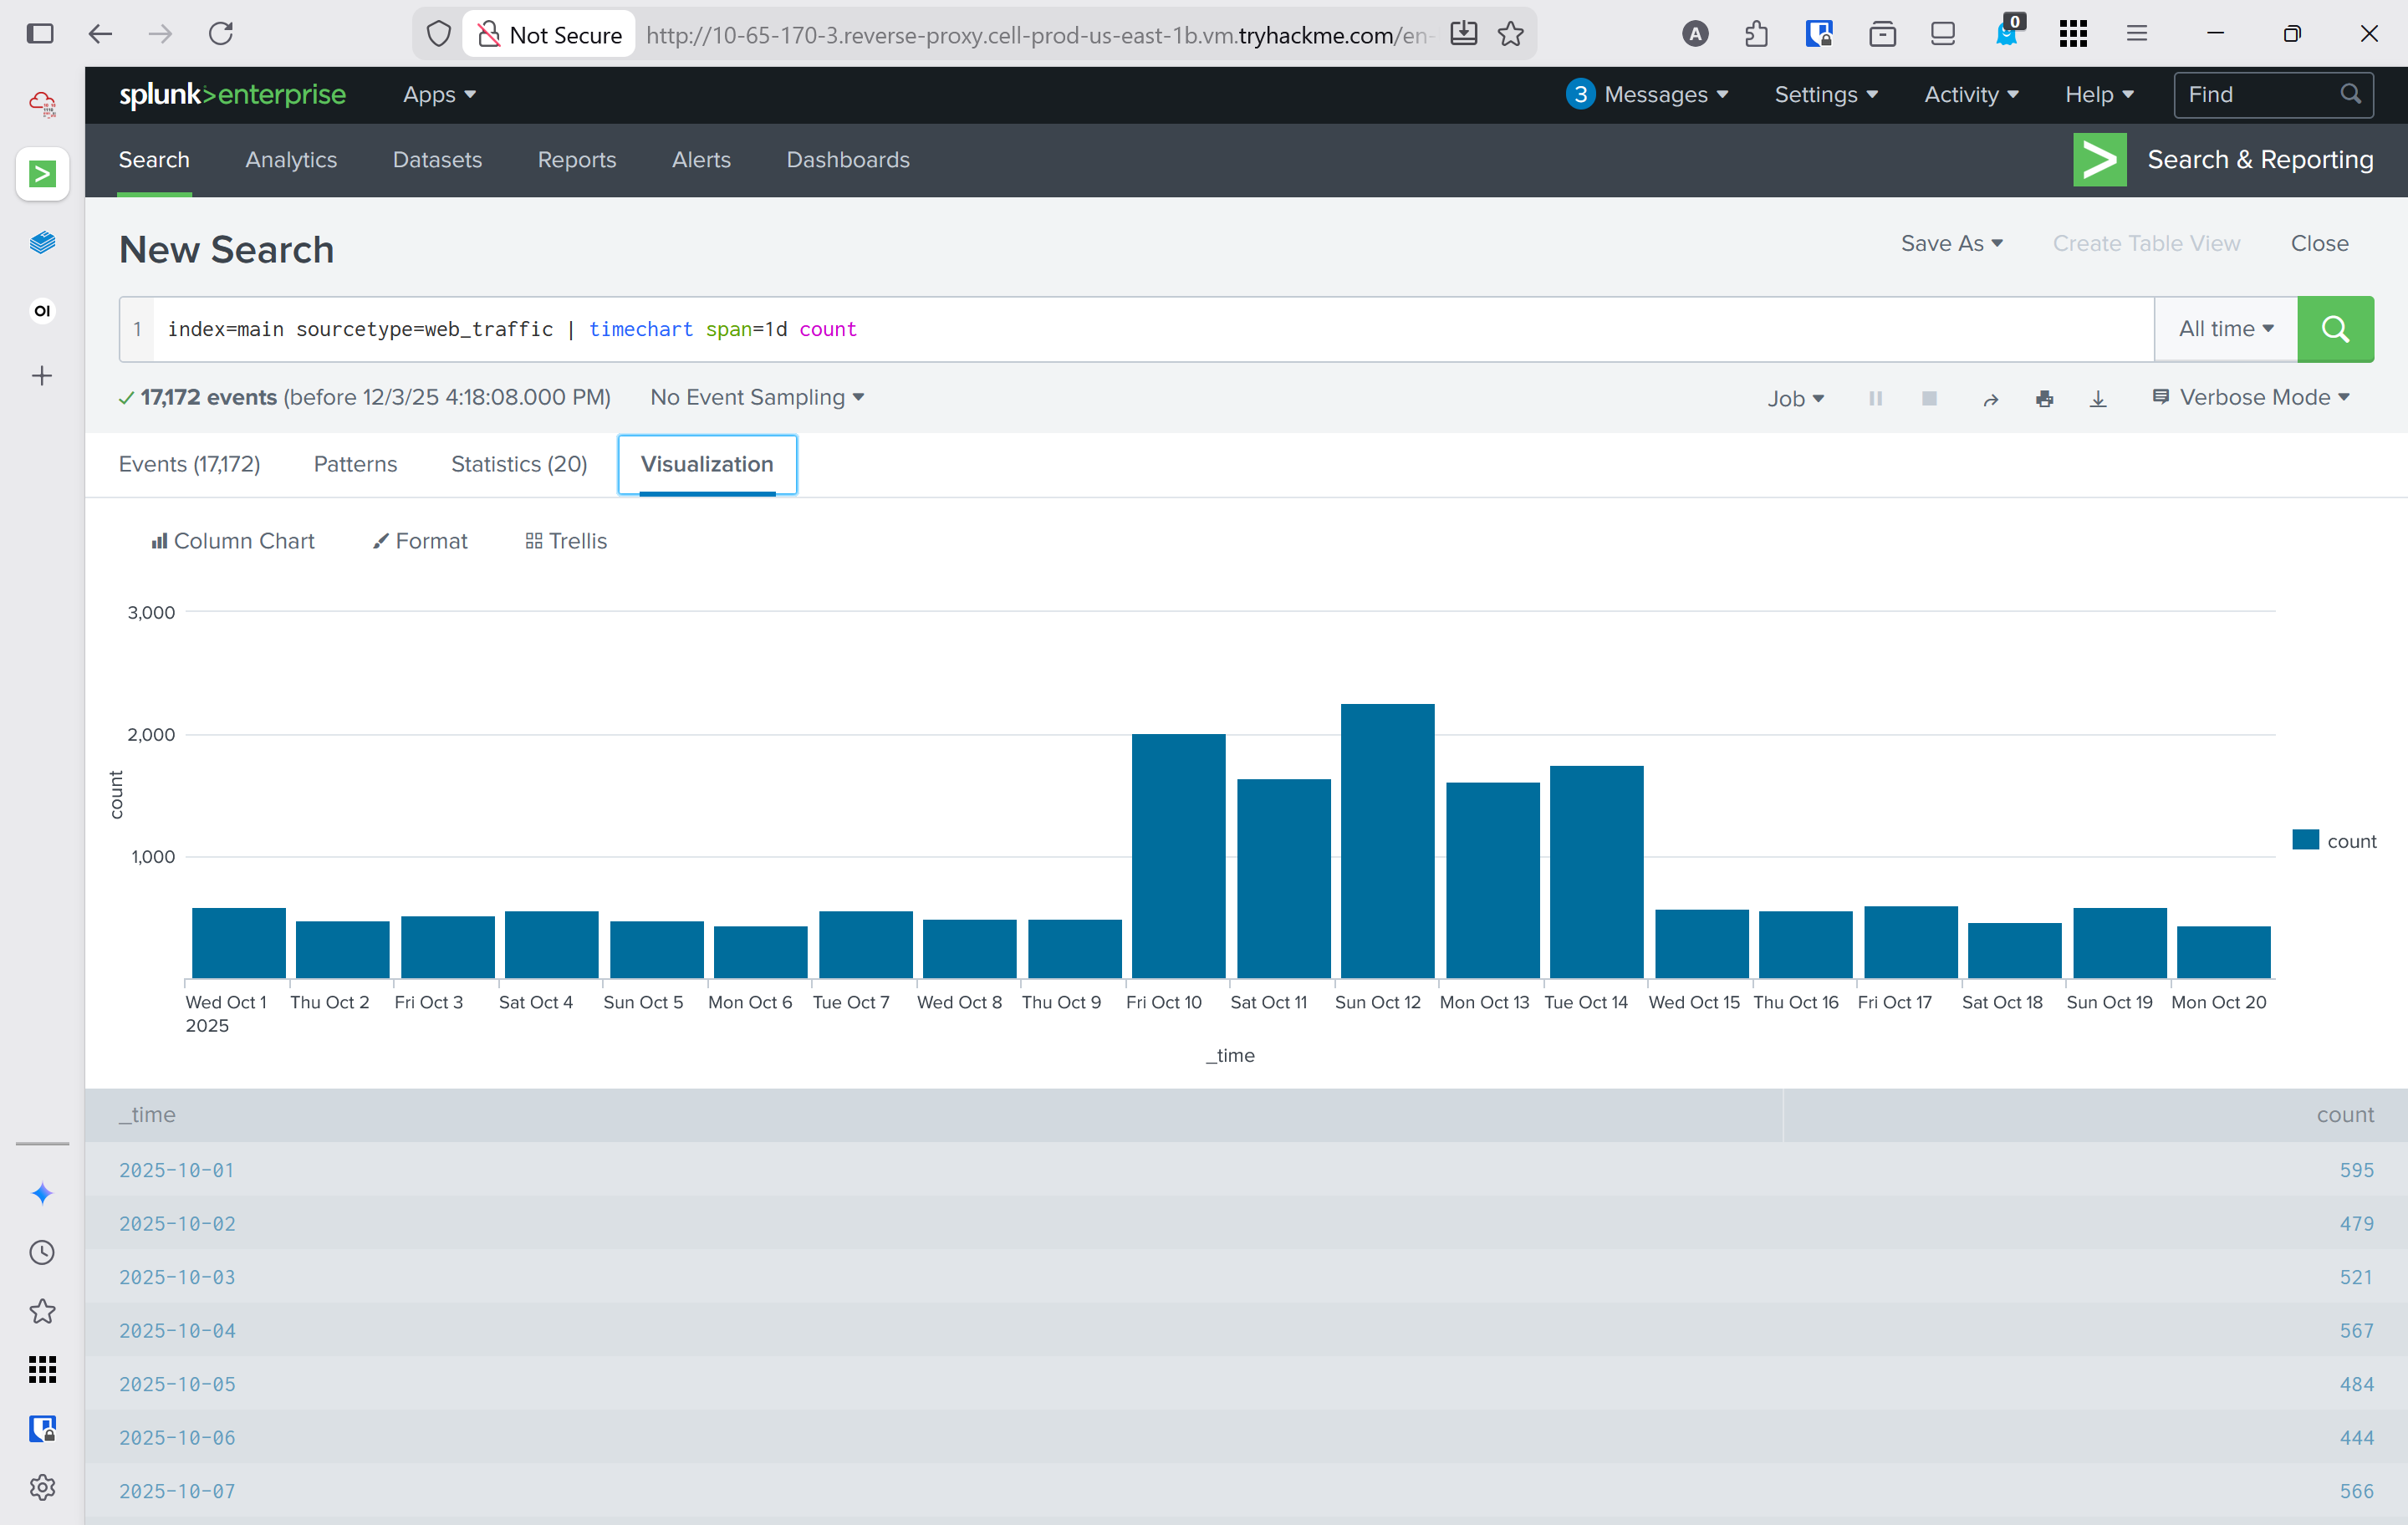
2. Timeline Analysis - Identifying the Attack Window
Query: index=main sourcetype=web_traffic | timechart span=1d count
Purpose: Visualizes event distribution across days to identify abnormal traffic spikes. This query creates a histogram showing daily log volume, which typically reveals when the attack occurred.
Output Enhancement: Append | sort by count | reverse to sort days by event count in descending order, placing the attack day at the top.
Investigative Value: Answers the critical question: "When did the attack happen?" Enables analysts to tighten time ranges for more focused investigation.
3. Anomaly Detection - Suspicious User Agent Filtering
Query: index=main sourcetype=web_traffic user_agent!=*Mozilla* user_agent!=*Chrome* user_agent!=*Safari* user_agent!=*Firefox*
Purpose: Eliminates legitimate browser traffic and surfaces suspicious automated tools and scripts used by attackers. User agents like curl, wget, sqlmap, and Havij immediately stand out as non-standard.
Why It Works: Legitimate users access web servers via standard browsers; attackers use command-line tools and specialized exploitation frameworks that generate distinctive user agent strings.
4. Identifying the Primary Attacker IP
Query: sourcetype=web_traffic user_agent!=*Mozilla* user_agent!=*Chrome* user_agent!=*Safari* user_agent!=*Firefox* | stats count by client_ip | sort -count | head 5
Purpose: Quantifies malicious requests by source IP and ranks them, identifying the primary attacker. The - in sort -count sorts in descending order.
Output: Lists the top 5 IPs responsible for suspicious activity. The highest-count IP (198.51.100.55 in this investigation) is typically the attacker.
Investigative Advantage: Focuses subsequent queries on a single attacker IP, reducing noise and enabling deep-dive analysis of their attack progression.
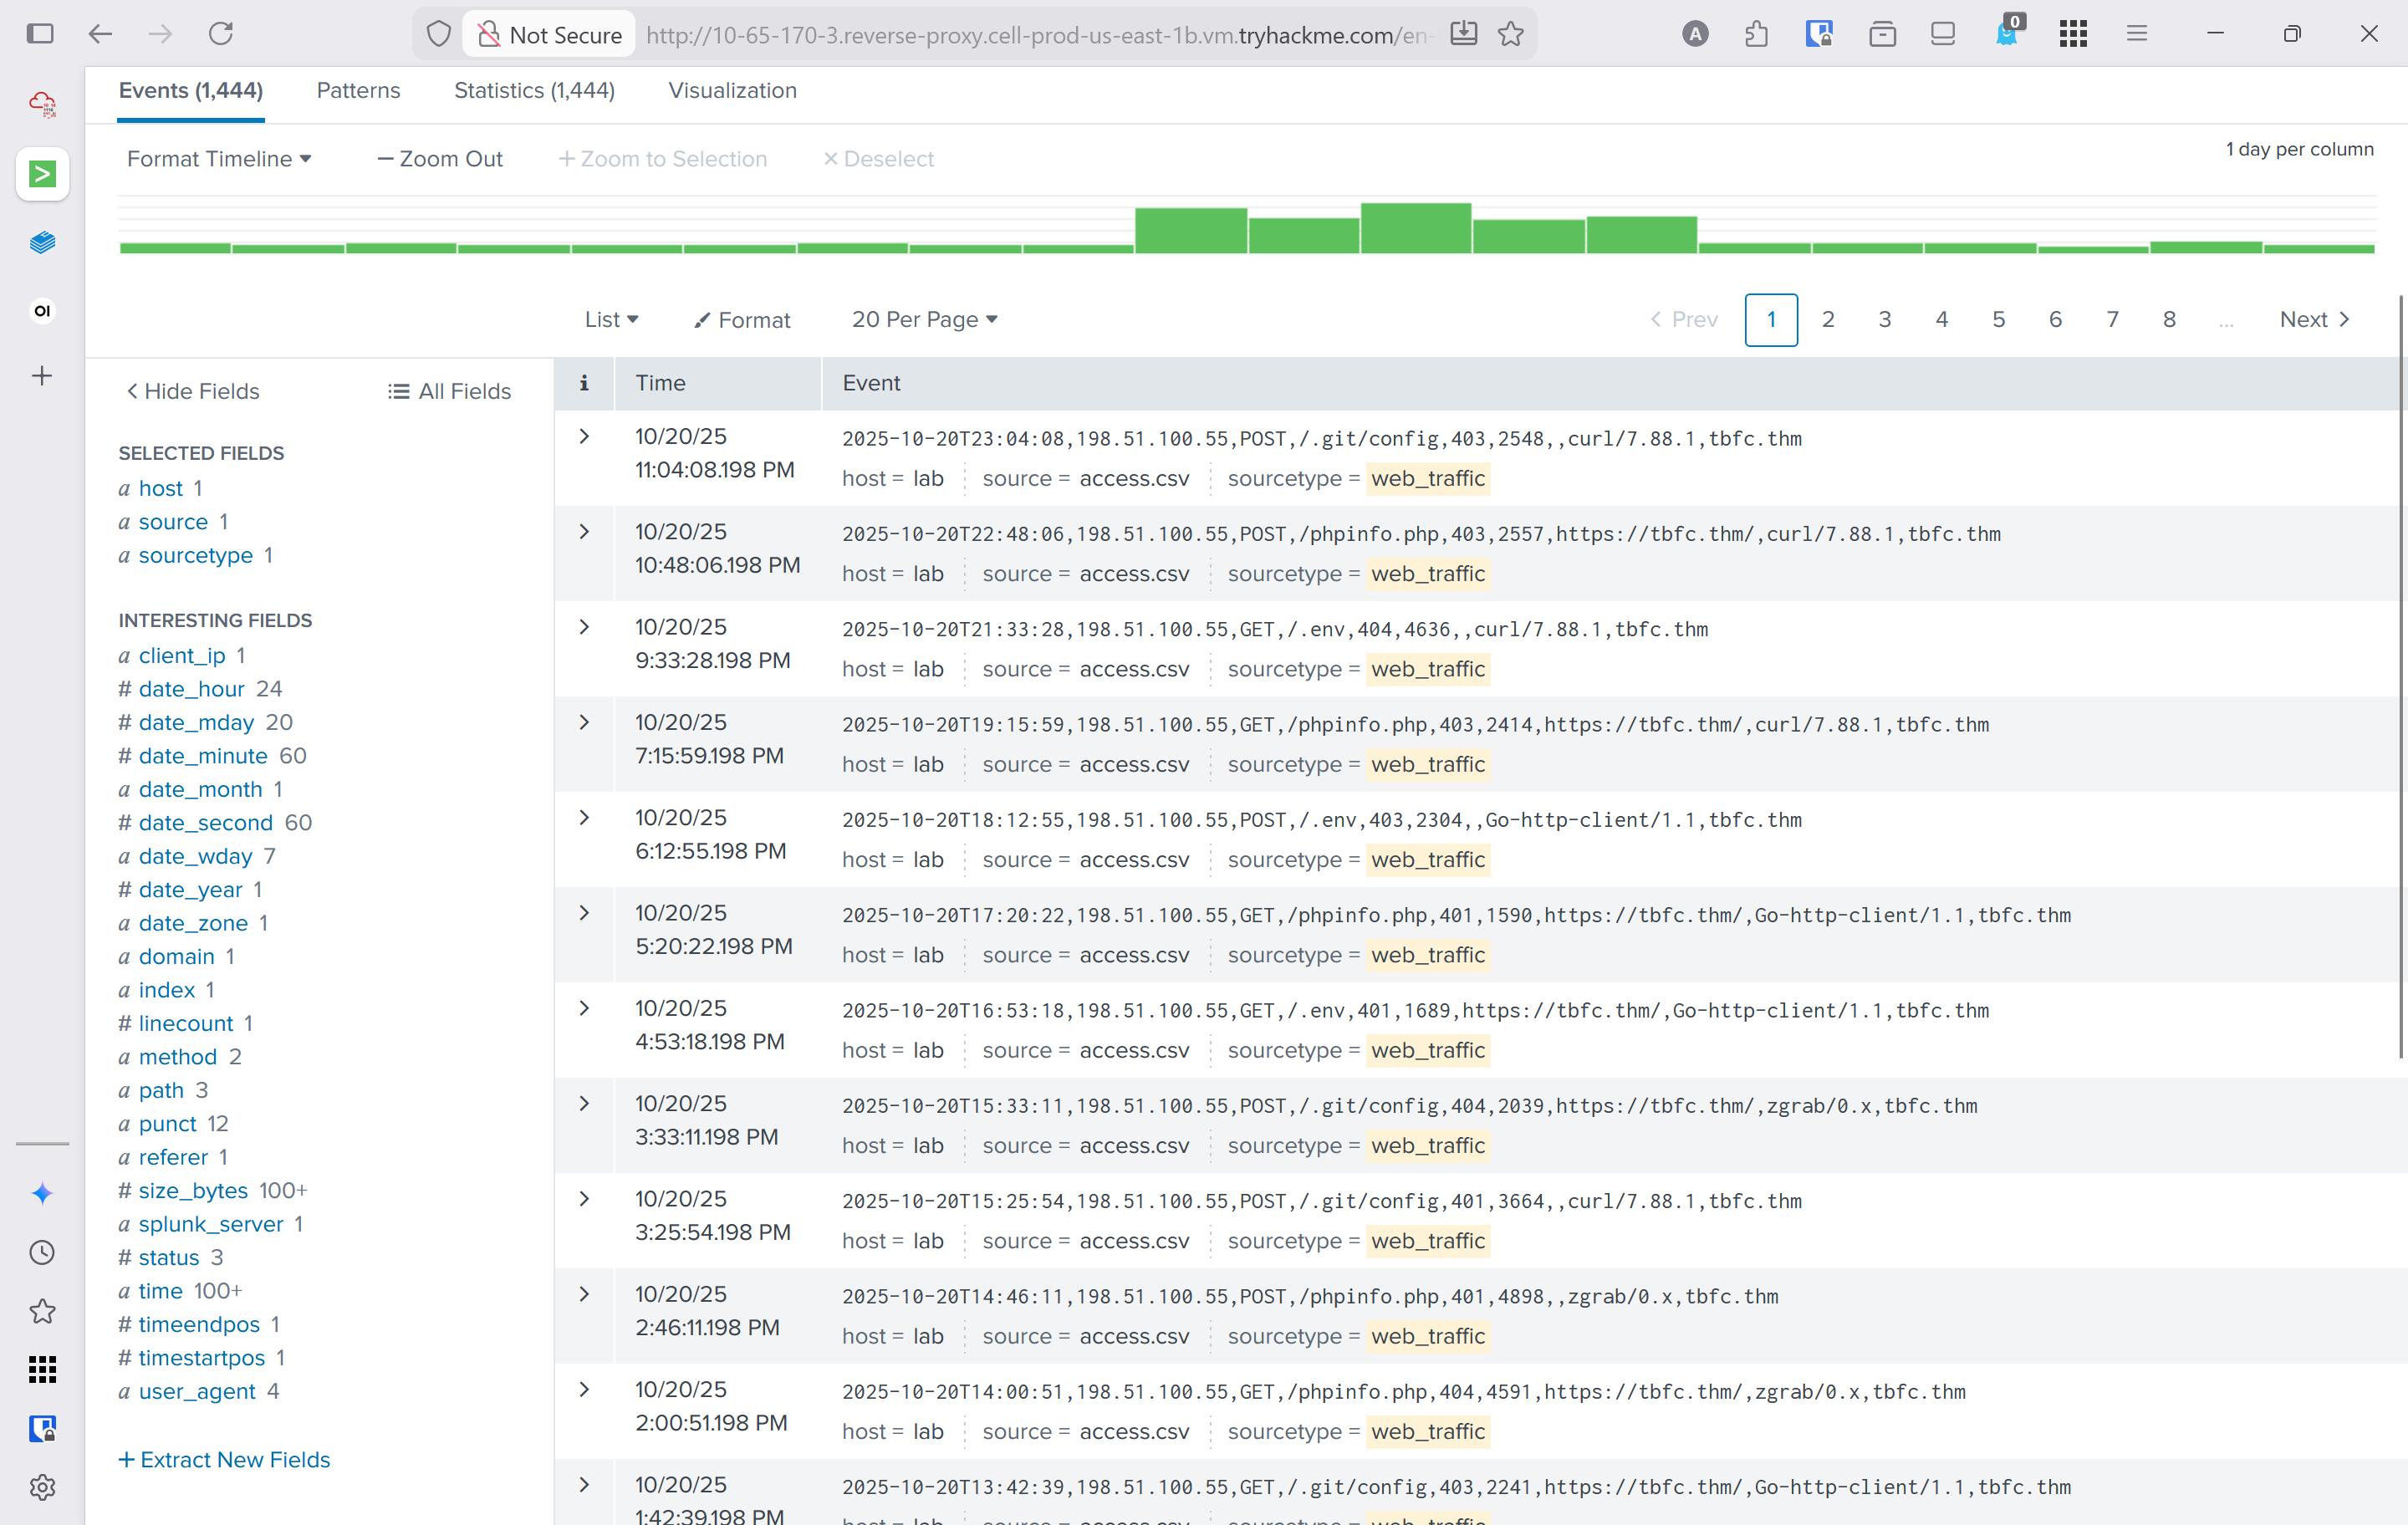
5. Reconnaissance Phase - Configuration File Probing
Query: sourcetype=web_traffic client_ip="198.51.100.55" AND path IN ("/.env", "/*phpinfo*", "/.git*") | table _time, path, user_agent, status
Purpose: Detects initial footprinting attempts where attackers probe for exposed configuration files (.env, .git directories) and PHP info pages. These requests typically receive 404, 403, or 401 responses.
Attack Context: This represents the reconnaissance phase—attackers gathering information about the target without attempting exploitation yet.
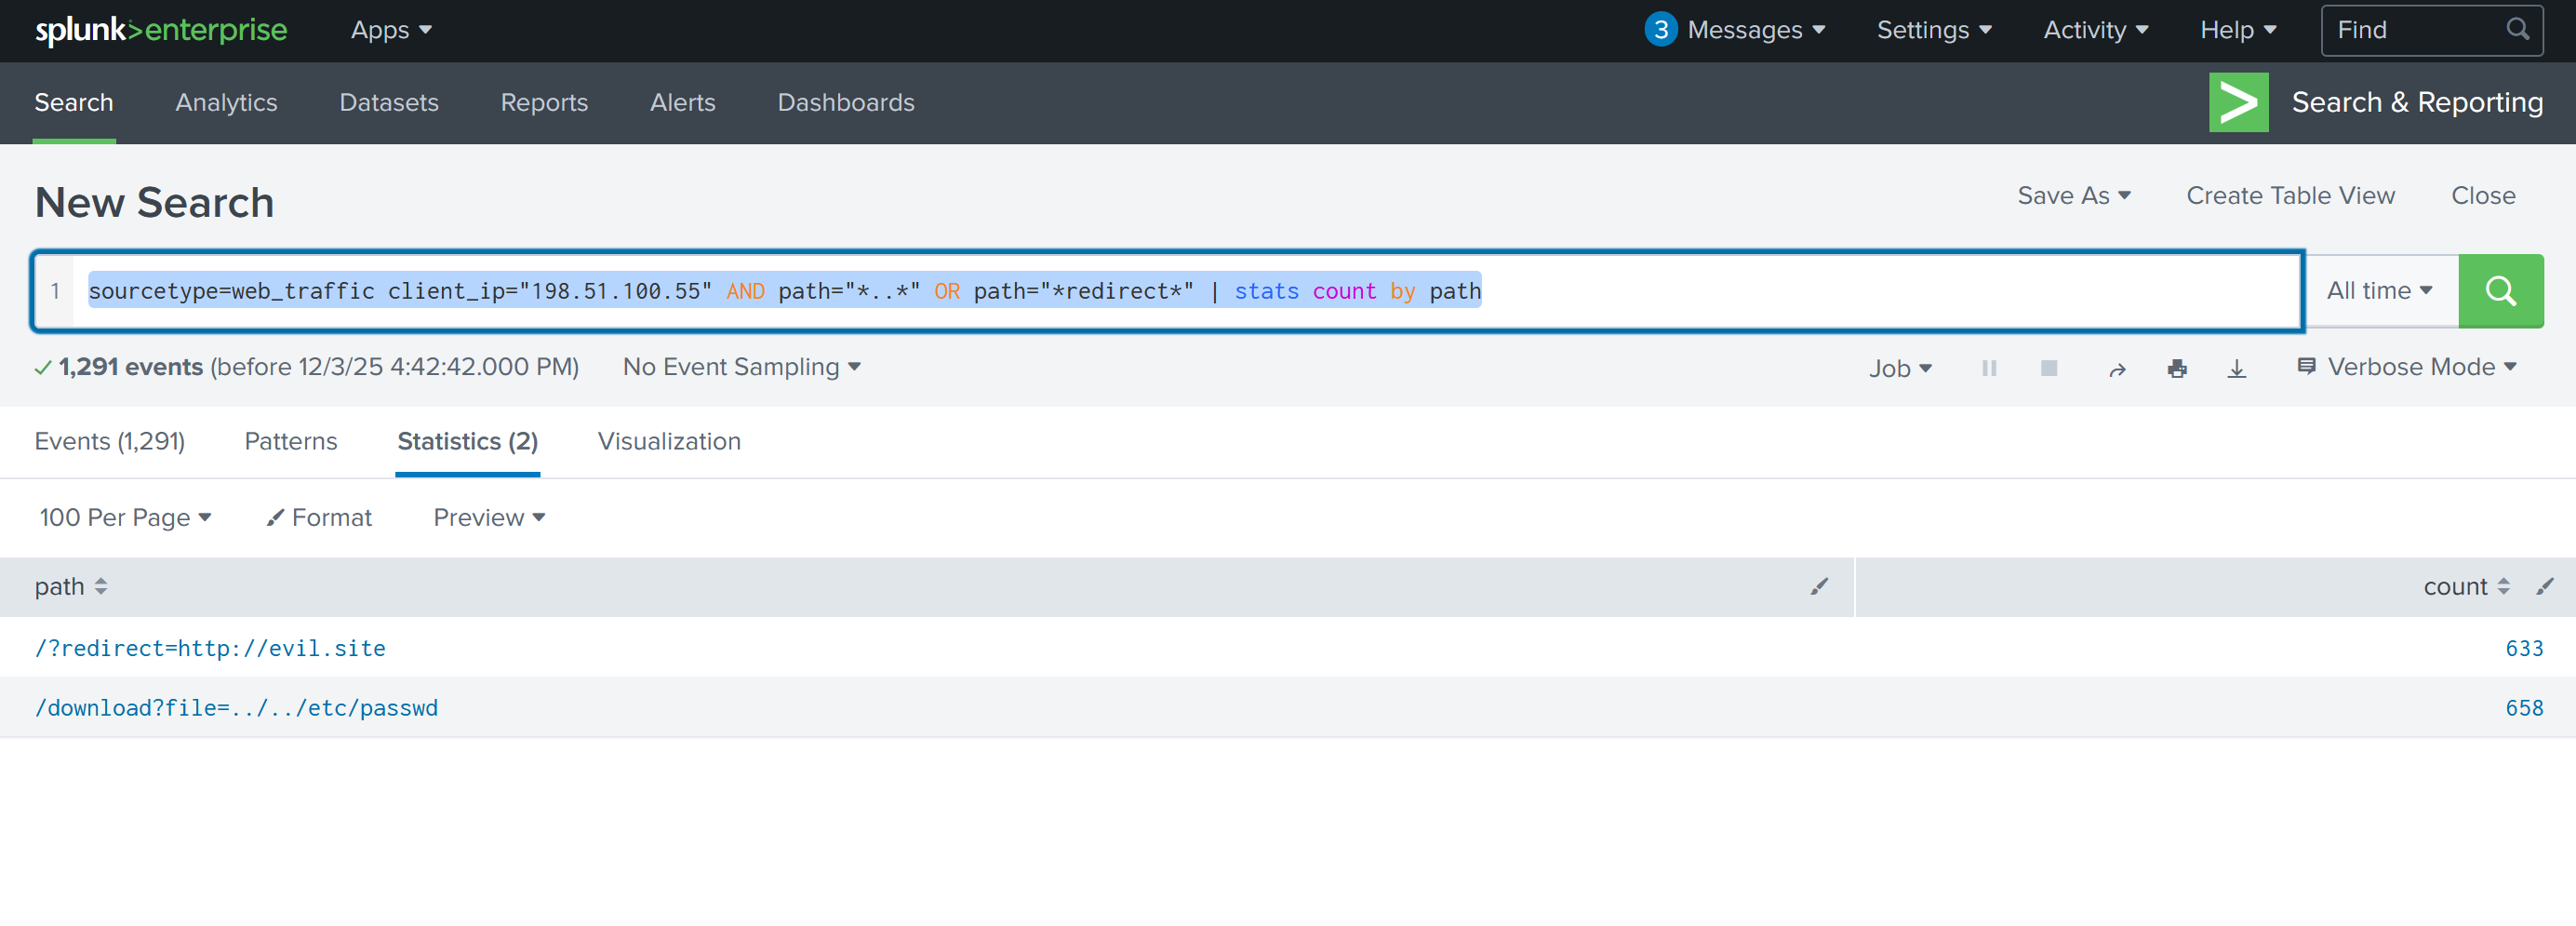
6. Enumeration Phase - Path Traversal & Open Redirect Attempts
Query: sourcetype=web_traffic client_ip="198.51.100.55" AND path="*..\/..\/*" OR path="*redirect*" | stats count by path
Purpose: Identifies attempts to exploit path traversal vulnerabilities (e.g., ../../etc/passwd) and open redirect flaws. The stats count by path aggregation shows which sensitive files were targeted and how many times.
Output in This Challenge:
- 658 attempts to access
/etc/passwd - 633 URL redirect attack attempts
Significance: Confirms the attacker moved from passive scanning to active vulnerability testing.
7. SQL Injection Attack Detection
Query: sourcetype=web_traffic client_ip="198.51.100.55" AND user_agent IN ("*sqlmap*", "*Havij*") | table _time, path, status
Purpose: Identifies automated SQL injection tools (sqlmap, Havij) and their payloads. Pay attention to 504 status codes, which often indicate successful time-based SQL injection (the server delays responding, confirming the injection worked).
Attacker Behavior: Demonstrates the exploitation phase where automated tools attempt to extract database contents or escalate privileges.
8. Data Exfiltration - Sensitive File Download Attempts
Query: sourcetype=web_traffic client_ip="198.51.100.55" AND path IN ("*backup.zip*", "*logs.tar.gz*") | table _time, path, user_agent
Purpose: Detects attempts to download large compressed files containing backups and logs. Tools like curl, wget, and zgrab are commonly used for file extraction.
Threat Implication: Signals preparation for double-extortion ransomware attacks—attackers gather sensitive data both for encryption and blackmail purposes.
9. Remote Code Execution (RCE) & Webshell Execution
Query: sourcetype=web_traffic client_ip="198.51.100.55" AND path IN ("*bunnylock.bin*", "*shell.php?cmd=*") | table _time, path, user_agent, status
Purpose: Identifies successful webshell uploads and command execution. Requests like /shell.php?cmd=./bunnylock.bin confirm the attacker achieved full RCE and executed ransomware payloads.
Critical Finding: A successful RCE represents the "Action on Objective"—the point where the attacker has moved from reconnaissance to active system compromise.
10. Command & Control (C2) Communication - Outbound Connections
Query: sourcetype=firewall_logs src_ip="10.10.1.5" AND dest_ip="198.51.100.55" AND action="ALLOWED" | table _time, action, protocol, src_ip, dest_ip, dest_port, reason
Purpose: Pivots to firewall logs to confirm post-exploitation activity. Shows the compromised web server (10.10.1.5) establishing outbound connections to the attacker's C2 server. The action="ALLOWED" and reason="C2_CONTACT" fields confirm malicious communication.
Investigative Power: Proves the web server is under active attacker control and communicating with external command infrastructure.
11. Data Exfiltration Volume - Bytes Transferred to C2
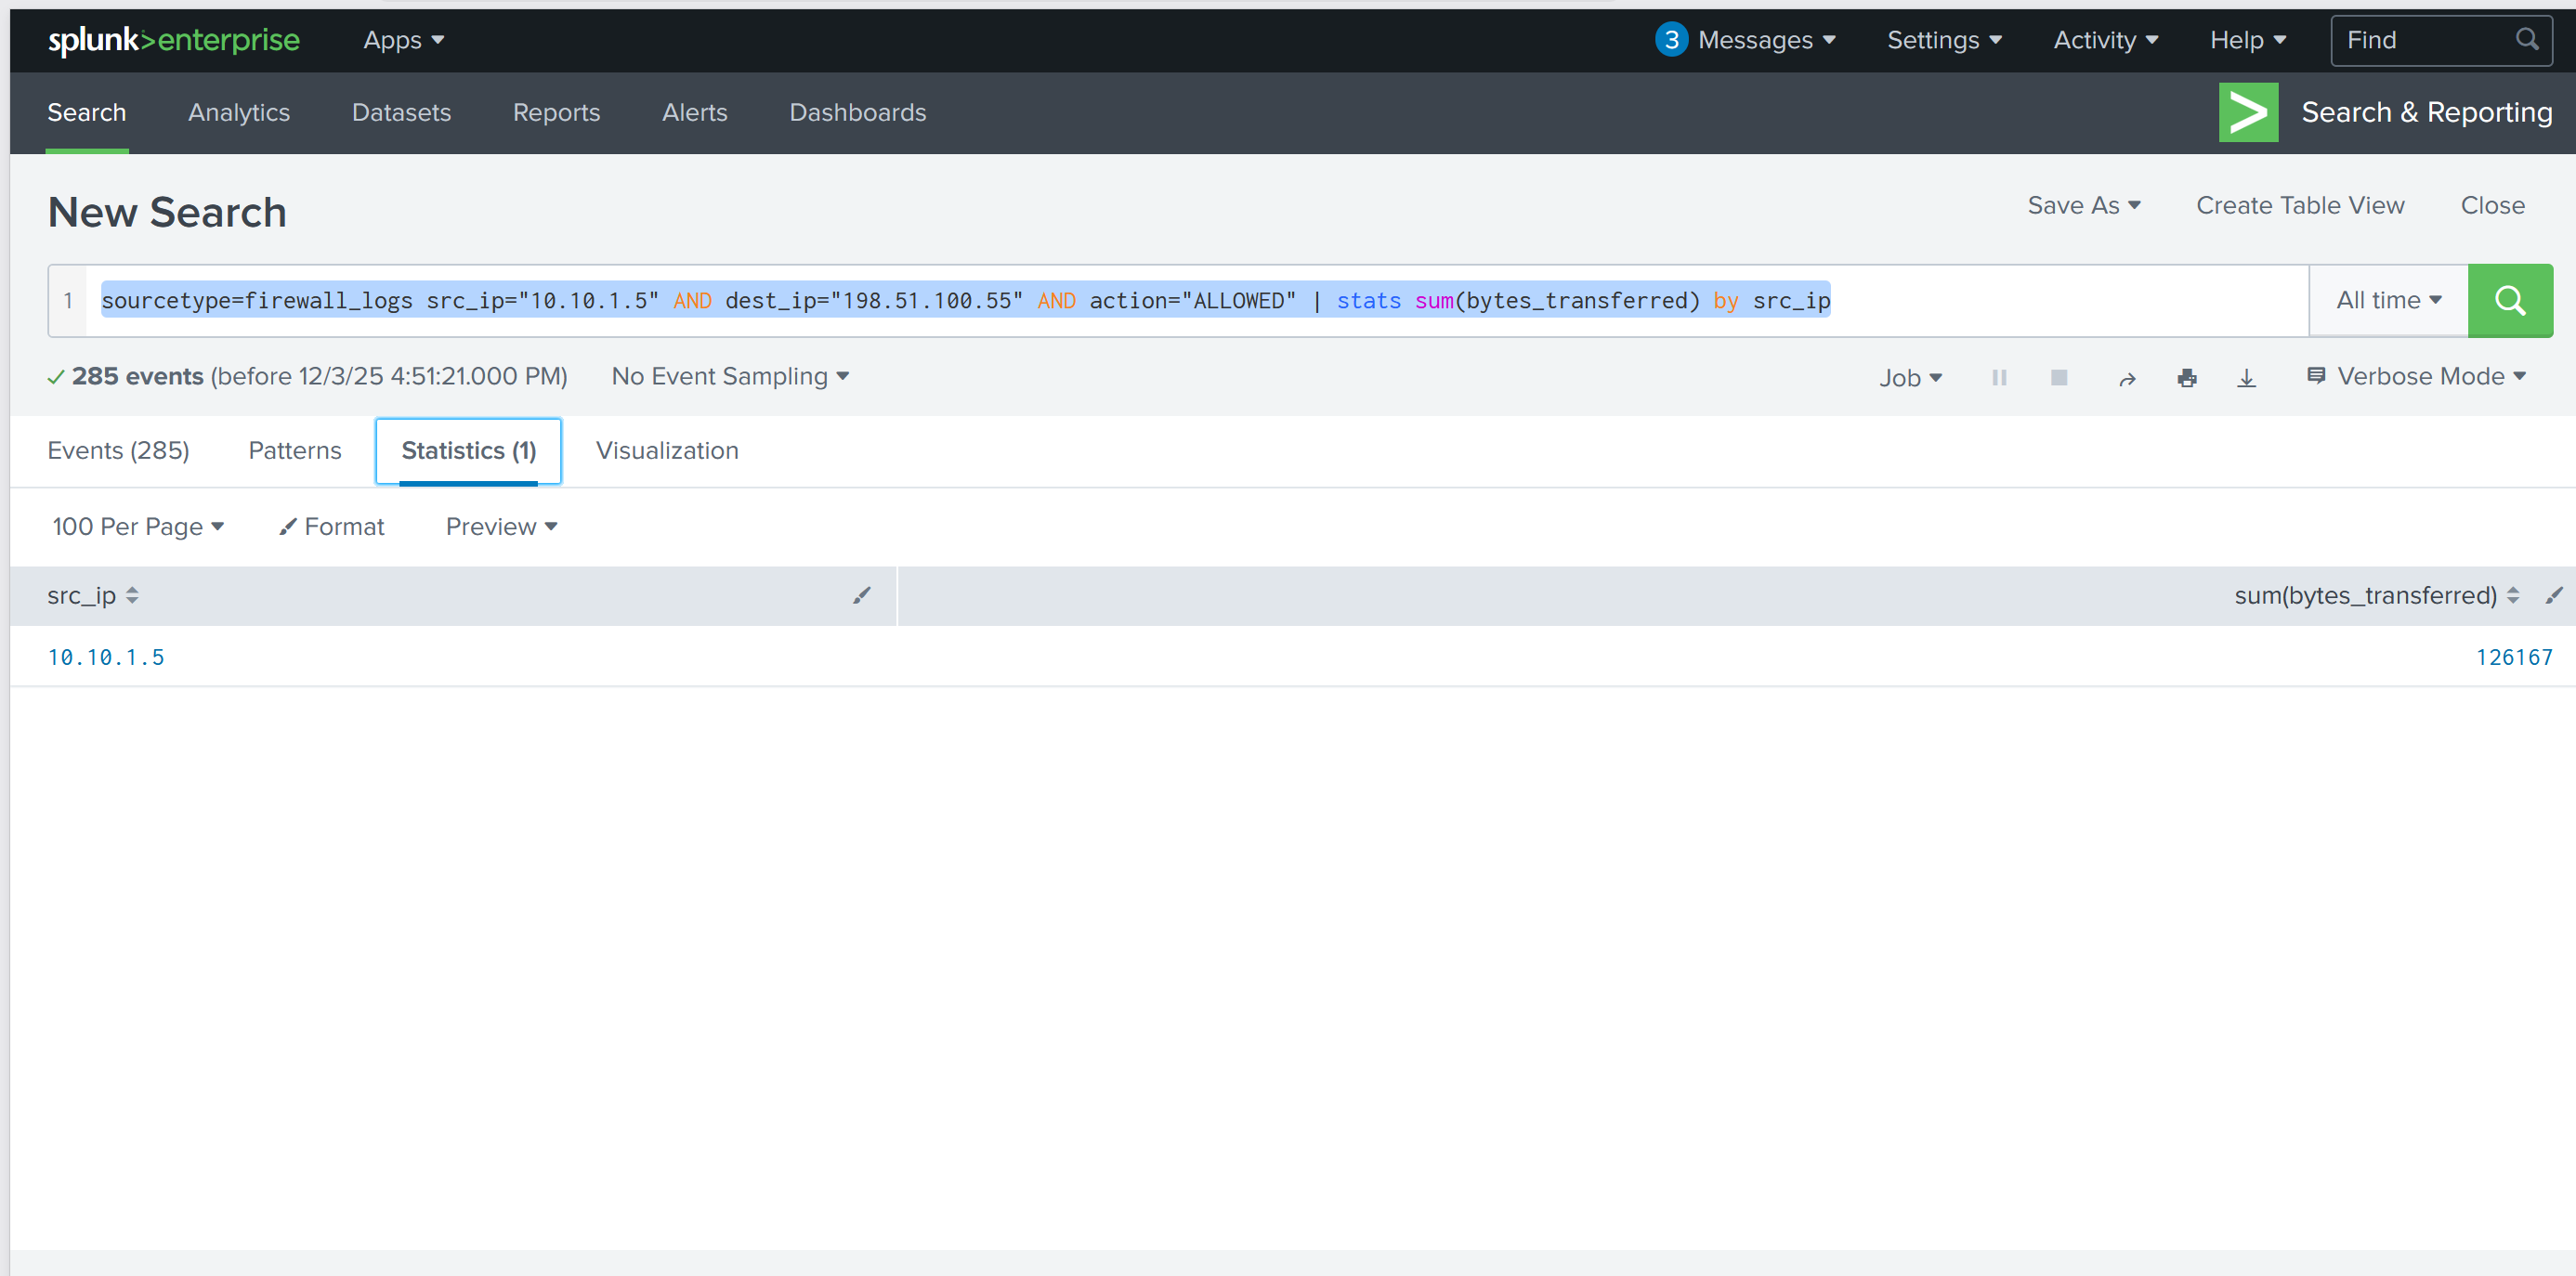
Query: sourcetype=firewall_logs src_ip="10.10.1.5" AND dest_ip="198.51.100.55" AND action="ALLOWED" | stats sum(bytes_transferred) by src_ip
Purpose: Quantifies the total data exfiltrated from the compromised server to the attacker's C2 infrastructure. Uses the sum() aggregation function to calculate total bytes.
Output in This Investigation: 126,167 bytes transferred—evidence of substantial data theft.
Reporting Value: This metric is crucial for incident reporting, damage assessment, and understanding the scope of the breach.
Walk Through
- Enable the splunk online instance (Logs are already ingested upon vm starting)
- What is the attacker IP found attacking and compromising the web server?
- Search term
index=main& timeframeAll Time- 2 source types.
web_traffic&firewall_logs - Webserver local ip
10.10.1.5
- 2 source types.
index=main sourcetype=web_trafficto view just web trafficindex=main sourcetype=web_traffic | timechart span=1d countto visualize the timeline- Reverse the query to show the days with the max number at the beginning
Search query: index=main sourcetype=web_traffic | timechart span=1d count | sort by count | reverse - Using the events tab to see data about the events and interesting fields
client_iprevealed198.51.100.55with7,876entries
- Search term
- Which day was the peak traffic in the logs? (Format: YYYY-MM-DD)
- Using the three interesting fields displayed the year, month, and day with the peak traffic
date_yeardate_monthdate_mday October 12, 2025
- Using the three interesting fields displayed the year, month, and day with the peak traffic
- What is the count of Havij user_agent events found in the logs?
- This can be found in the
user_agentinteresting field. 993
- This can be found in the
- How many path traversal attempts to access sensitive files on the server were observed?
- Filtering out benign values by adding
user_agent!=*Mozilla* user_agent!=*Chrome* user_agent!=*Safari* user_agent!=*Firefox*to the query- This query would be used to help narrow down suspicous IP's
sourcetype=web_traffic user_agent!=*Mozilla* user_agent!=*Chrome* user_agent!=*Safari* user_agent!=*Firefox* | stats count by client_ip | sort -count | head 5
- This query would be used to help narrow down suspicous IP's
- Reconnisance
sourcetype=web_traffic client_ip="198.51.100.55" AND path IN ("/.env", "/*phpinfo*", "/.git*") | table _time, path, user_agent, statuscurl&wgetwere met with404401and403
- Vulnerability testing
sourcetype=web_traffic client_ip="198.51.100.55" AND path="*..*" OR path="*redirect*"- This shows what the attackers were trying to access
- sourcetype=web_traffic client_ip="198.51.100.55" AND path=".." OR path="redirect" | stats count by path
- This displays how many attempts there were for each path.

658attempts to access/etc/passwd633url redirects
- Filtering out benign values by adding
- Examine the firewall logs. How many bytes were transferred to the C2 server IP from the compromised web server?
sourcetype=firewall_logs src_ip="10.10.1.5" AND dest_ip="198.51.100.55" AND action="ALLOWED" | table _time, action, protocol, src_ip, dest_ip, dest_port, reason- view the c2 events
sourcetype=firewall_logs src_ip="10.10.1.5" AND dest_ip="198.51.100.55" AND action="ALLOWED" | stats sum(bytes_transferred) by src_ip- count the bytes transfered
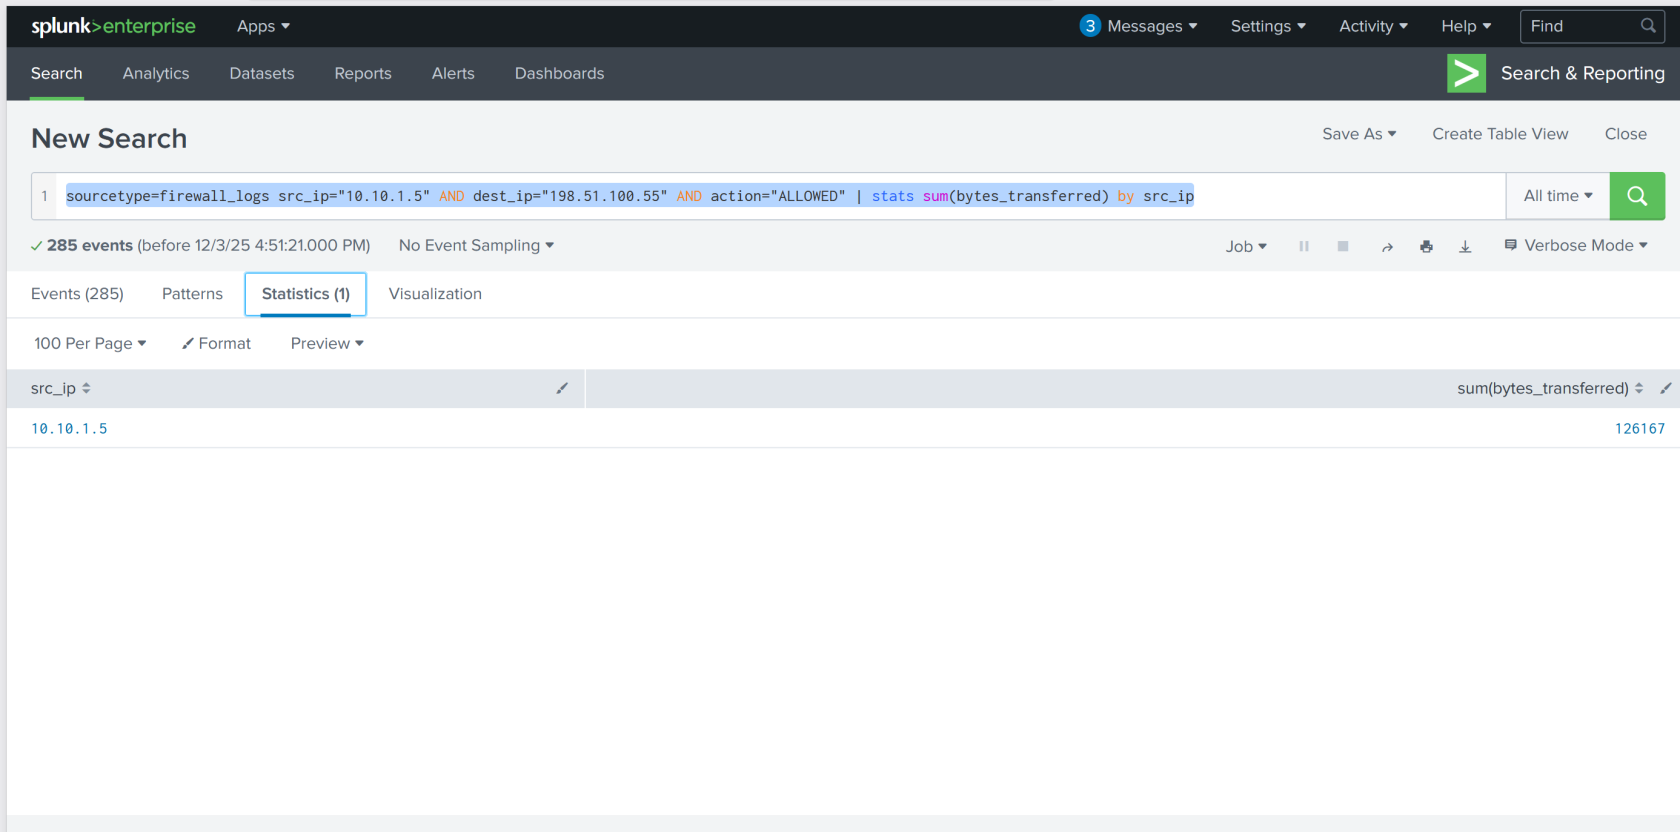
126167
Lessons Learned
- Mastered Splunk-based incident response: Successfully used log aggregation, timeline analysis, and multi-source correlation to reconstruct a sophisticated attack chain spanning reconnaissance, exploitation, and data exfiltration.
- Applied threat hunting methodology: Filtered out benign traffic, identified anomalous patterns through user agent and IP analysis, and traced attacker activities chronologically across web and firewall logs to quantify damage and confirm command-and-control communications—critical skills for detecting and responding to advanced threats like King Malhare's ransomware campaign.